Designing Charts
Overview
To make a chart in MarketSight, you can either use the chart wizard on the Charts page, or you can make a customized crosstab that the chart will pull its data from. Since MarketSight charts are always based on a crosstab, a general rule of thumb is, "if you can show it in a crosstab, you can chart it." Many options, such as which calculations you can choose to display, are determined by what is shown in the underlying crosstab.
Once you have charts based on a particular crosstab, be careful when editing that crosstab! Removing a column variable, for example, could invalidate the chart's structure and delete it. To preserve your charts, keep the following in mind:
- You can make any changes to Filters.
- You can check different values for row variables, as long as some values remain checked.
- You can add new calculations to row variables, as long as you don’t delete the original calculations.
- You can add new row variables.
99% of the time, you'll be able to create a chart from your crosstab. There are, however, a couple rare circumstances where you'll find the charting button disabled in order to preserve system performance:
- A variable used in the crosstab has more than 250 values and it displays column % or count
- The quantity of data in the crosstab is large and the variables it uses display column % or count
For additional information on the chart editor, please see Chart Options.

Create a Single Chart
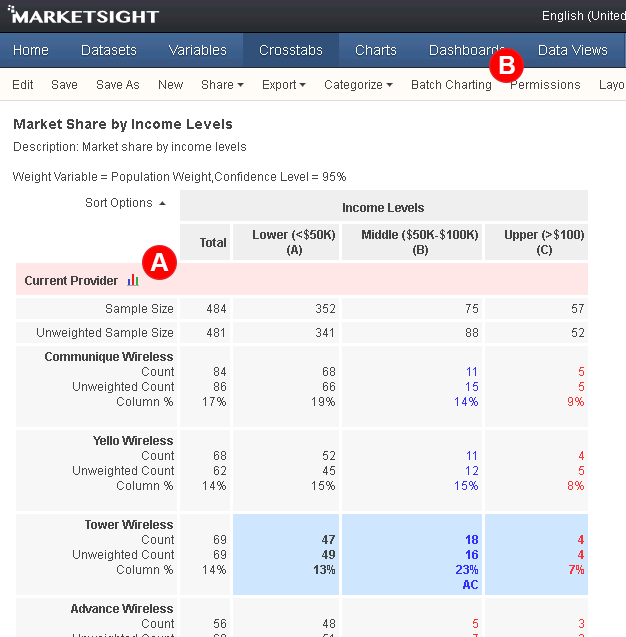
- Click the chart icon next to the name of a row variable in a crosstab (A)
- Select an applicable chart type, or
- On the Charts list page, click the icon of the chart type you'd like to create
Create Multiple Charts with Batch Charting
- Open a crosstab that contains multiple row variables
- Click on Batch Charting in the gray toolbar (B)
- Select your desired settings
- Save to MarketSight for later viewing and export, or
- Export directly to PowerPoint
Change Chart Type
- Open the chart from the Charts page
- Click on one of the available chart types in the gray toolbar (classic) / dropdown in the upper right cornerl (new), or
- Open the editor
- Select the desired chart type
Change Chart Size
- Open the chart from the Charts page
- Open the chart editor
- In the chart panel on the right, use the box handles to manually resize the chart, or
- On the display tab in the left panel (classic) / under Visualize > General (new), specify exact pixel dimensions, or
- Select the checkbox for Auto-resize to enable the chart to automatically adjust dimensions in view mode
Add Additional Row Variables to a Chart
- Open the chart from the Charts page
- Edit the chart and select the Data tab (classic) / expand the Data > Variables section (new)
- Choose additional row variables to chart
Add a Total to a Chart
- When viewing the chart, open the editor
- Select the Data tab (classic) / expand the Data > Calculation section (new)
- Click "Show Total"
- Click OK
Adjust Numeric Axis Scale
- When viewing the chart, open the editor
- Select the Numeric Axis tab (classic) / click on Visualize > Axis (new)
- Adjust settings as necessary
- Click Save to keep your changes
Display Statistical Significance in Charts
- Edit the chart
- Select the Design tab (classic), click the Statistical Significance checkbox under "Additional Display Options" near the bottom
- Expand the Data > Statistical Significance section (new), click "Enable"
- Click Save to preserve your changes
Display Filter Details in Charts
- When viewing the chart, open the editor
- Select the Display tab (classic), check "Filter Details" under Additional Display Options
- Expand the Visualize > Footnotes section (new), check "Filter Footnote"
- Click Save to preserve your changes
Last Updated: 7/11/2019

